
Positive Cash Flow Property Millicent, SA, 5280
Millicent is a town in South Australia approximately 5 hours drive South Easy from Adelaide. It contains a variety of positive cash flow properties.
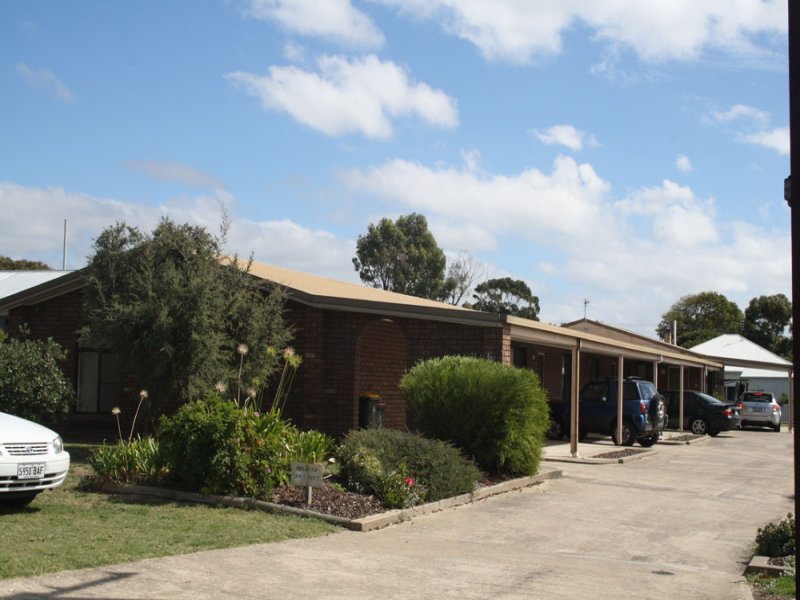
I have included an example property below which is a block of 4 units on a single title. With a rental yield of 7.38% this property has the possibility to generate a nice passive income for an investor interested in purchasing this property.
Example Property
[table class=”table-striped” colalign=”left|center|center” width=”95%”]
Asking Price,$370000
Rental Income,$530/Week
Rental Yield,7.38%
Listing Date,May 2013
[/table]
View this property and more by joining On Property Plus
Millicent Key Statistics
Town Population Statistics
[table class=”table-striped” colalign=”left|center|center|center” width=”95%”]
,2001,2006,2011
Urban Centre Population,4430,4771,4798
Postcode Area Population,7364,7567,7459
[/table]
Property Information
[table class=”table-striped” colalign=”left|center|center” width=”95%”]
,Millicent,SA,
Median House Price,$156000 (Q1 2014)
Median Rental Income,$130/week (2011)
Average Days On Market,~475 (Dec 13),162 (Dec 13)
Average Rental Yield,,4.8% (Dec 13)
Vacancy Rate,
Average Vendor Discounting,-10.25%
[/table]
Dwelling Breakdown 2011
[table class=”table-striped” colalign=”left|center|center” width=”95%”]
Bedrooms,Number Of Dwellings,Percentage Of Total Dwellings
1 Bedroom,57,1.9%
2 Bedroom,403,13.6%
3 Bedroom,811,61.1%
4 Bedroom,635,21.4%
[/table]
GOING TO ADD THESE LATER
Dwelling Breakdown (House, Unit, Townhouse etc)
Median Income
Owned vs Rented (or Rental Population)
Employment (Jobs)
Employment (Sector)
http://www.yourinvestmentpropertymag.com.au/top-suburbs/sa-5280-millicent.aspx
http://www.realestateinvestar.com.au/Property/millicent#rentalStats-tab
http://www.reisa.com.au/publicinfo/median-house-prices
| Occupation | Millicent | % | South Australia | % | Australia | % |
|---|---|---|---|---|---|---|
| Employed people aged 15 years and over | ||||||
| Labourers | 346 | 18.1 | 82,328 | 11.1 | 947,608 | 9.4 |
| Technicians and Trades Workers | 328 | 17.2 | 104,586 | 14.1 | 1,425,146 | 14.2 |
| Machinery Operators And Drivers | 234 | 12.3 | 47,070 | 6.4 | 659,551 | 6.6 |
| Clerical and Administrative Workers | 211 | 11.1 | 106,215 | 14.4 | 1,483,558 | 14.7 |
| Community and Personal Service Workers | 203 | 10.6 | 77,702 | 10.5 | 971,897 | 9.7 |
| Professionals | 189 | 9.9 | 145,127 | 19.6 | 2,145,442 | 21.3 |
| Managers | 184 | 9.6 | 93,293 | 12.6 | 1,293,970 | 12.9 |
| Sales Workers | 177 | 9.3 | 70,882 | 9.6 | 942,140 | 9.4 |
| Industry of employment, top responses | Millicent | % | South Australia | % | Australia | % |
|---|---|---|---|---|---|---|
| Employed people aged 15 years and over | ||||||
| Converted Paper Product Manufacturing | 204 | 10.7 | 1,684 | 0.2 | 14,237 | 0.1 |
| School Education | 107 | 5.6 | 33,978 | 4.6 | 467,373 | 4.6 |
| Supermarket and Grocery Stores | 91 | 4.8 | 20,834 | 2.8 | 235,773 | 2.3 |
| Sheep, Beef Cattle and Grain Farming | 59 | 3.1 | 14,136 | 1.9 | 120,143 | 1.2 |
| Cafes, Restaurants and Takeaway Food Services | 59 | 3.1 | 29,072 | 3.9 | 412,804 | 4.1 |
Millicent Location Map
[mappress mapid=”1″]
View positive cash flow properties in Millicent by joining On Property Plus