A Real Life Negative Gearing Example (With Explanations)
In this article I am going to go through the 2 most common negative gearing examples. We will look at the strategy behind them as well as dig into the numbers so you can see exactly how to calculate negatively geared properties for yourself.
 We are going to look at:
- The capital growth property
- The positive negative
These two negatively geared investment strategies are common in the Australian market. It took me about 5 minutes to find these 2 property examples using RealEstate.com.au
First Lets Look At How To Calculate Negative Geared Property
As I have already gone into detail about how to calculate the cash flow of a property investment this is going to be a quick overview.
[su_note]NOTE: Don’t forget to grab your free PDF reports showing the exact negative gearing example calculations[/su_note]
Step #1: Total Income
Firstly take your weekly rent and multiply it by 52 to get your total income for the year (we will take out vacancies in the expenses column)
Step #2: Tally up expenses
Next step is to tally up all of your expenses. Below is a pretty extensive list and should cover most expenses, but every property is different and may include expenses not included in the list below.
– Mortgage repayments
– Property manager fees (if you want to learn how to manage your property yourself check out The Complete Self-Leasing Kit)
– Expected Vacancy
– Repairs and Maintenance
– Insurance
– Council Rates
– Bank Fees
– Water Rates
– Strata/Body Corporate Fees
– Land Tax
– Property Improvements (not deductible)
If you want a tool that helps you add up all these expenses and does the calculations for you then you will want to get access to the Advanced Property Calculator.
Step #3: Minus Expenses From Income
If the property is negatively geared like our examples below then this calculation will result in a loss.
Step #4: Deduct Depreciation From Your Cash Flow Loss/Profit
Depreciation is an ‘on paper’ loss you can claim due to the lowering in value of the building itself or items within the property. This is confusing so if you want to learn more then go through our depreciation series. But basically you can claim extra expenses that you aren’t actually paying out of your pocket each year (because you paid for the items up front).
Step #5: Calculate Tax Payable or Refundable
Based on whether you made a profit or a loss ‘on paper’ after depreciation was taken into account you now need to take that to your accountant and work out whether you owe the ATO money or if you are eligible for a refund. As you will see in the negative gearing examples below, you are almost always eligible for tax refund if your property is negatively geared. OK, now that we explained how it is worked out let’s look at some real life examples.
1. The Capital Growth Property
 The ‘capital growth property’ is a property that loses you money in year in negative cash flow (even after depreciation and tax refunds are taken into account) with the goal of the property increasing in value. The property must increase in value MORE THAN what you are spending on it in order for most investors to consider this a profitable investment.
 Real life ‘Capital Growth’ Example:
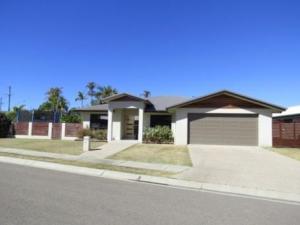
1 Lexington Court, Bowen, Qld, 4805
#disclaimer: Figures used for this example are estimates only and should not be seen as reflective of true results if you were to purchase the property. This is for educational purposes only, always seek professional advice before making financial decisions.
Basic Financial Details
[su_table]
| Asking Price: | $420,000 |
| Estimated Rental Income: | $360/week |
| Gross Rental Return: | 4.46% |
[/su_table]
Property Details
[su_table]
| Bedrooms: | Bathrooms: | Car Spots: |
| 4 | 2 | 2 |
[/su_table]
Income
$18,980.00
Annual Expenses
$24,388.00
[su_table]
| Interest Costs | $323.08/week |
| Property Manager Fees | $21.90/week |
| Expected Vacancy | $18.25/week |
| Repairs and Maintenance | $19.23/week |
| Insurance | $23.08/week |
| Council Rates | $38.46/week |
| Bank Fees | $1.92/week |
| Water Rates | $23.08/week |
| Strata/Body Corporate | $0/week |
| Land Tax | $0/week |
| Property Improvements | $0/week |
[/su_table]
[su_note]Download the Cash Flow PDF Reportfor a full list of expenses broken down in an easy to read weekly and annual format.[/su_note]
Cash Flow Before Tax
-$104.00/week or -$5,408.00/year
Depreciation
Estimated $8,000 in depreciation
Tax Refund @32.5%
$4,682.60 ($13,408 x 0.325)
Cash Flow After Tax
-$13.95/week or -$725.40/year
So as you can see in this negative gearing example it is estimated that this property will COST the investor money before AND after tax is taken into account. The tax refund is not enough to make the property positive cash flowed.
In this example the property would need to grow by at least $725.40 in this financial year for the property to appear profitable on paper (excluding buying and selling costs). This is a small 0.17% growth.
However, an investor would probably be looking for more than a 0.17% growth to consider this a good investment.
2. The Positive Negative Property

The ‘positive negative’ is a fun one to look at because it is a property that costs you money before you take tax into account but actually makes you money once you have done your tax return.
If you are super smart you can get estimates done by your accountant before tax time so that you receive any eligible refund on a quarterly basis rather than having to wait until the end of the financial year.

Real Life ‘Positive Negative’ Example:
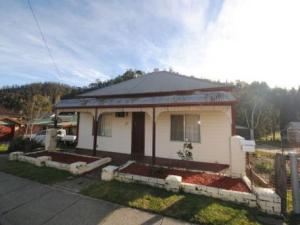
154 Bells Road, Lithgow, NSW, 2790
#disclaimer: Figures used for this example are estimates only and should not be seen as reflective of true results if you were to purchase the property. This is for educational purposes only, always seek professional advice before making financial decisions.
Basic Financial Details
[su_table]
| Asking Price: | $245,000 |
| Estimated Rental Income: | $260/week |
| Gross Rental Return: | 5.52% |
[/su_table]
Property Details
[su_table]
| Bedrooms: | Bathrooms: | Car Spots: |
| 3 | 1 | – |
[/su_table]
Income
$13,520.00
Annual Expenses
$15,831.40
[su_table]
| Interest Costs | $188.46/week |
| Property Manager Fees | $15.60/week |
| Expected Vacancy | $5.20/week |
| Repairs and Maintenance | $16.35/week |
| Insurance | $19.23/week |
| Council Rates | $38.46/week |
| Bank Fees | $1.92/week |
| Water Rates | $19.23/week |
| Strata/Body Corporate | $0/week |
| Land Tax | $0/week |
| Property Improvements | $0/week |
[/su_table]
[su_note]Download the Cash Flow PDF Reportfor a full list of expenses broken down in an easy to read weekly and annual format.[/su_note]
Cash Flow Before Tax
-$44.45/week or -$2,311.40/year
Depreciation
Estimated $5,000 in depreciation
Tax Refund @32.5%
$2,652.45 ($7,311.40 x 0.325)
Cash Flow After Tax
+$6.56/week or +$341.05/year
So as you can see in the example we have provided this property loses money before taking tax into account. But once depreciation is taken into account and a tax refund in gain the property becomes slightly positive cash flowed.
What Can These Negative Gearing Examples Teach Us?
These cash flow calculations reiterate how important it is to do your cash flow analysis BEFORE you buy a property.
This analysis will help you understand whether or not you can afford a property and it will also allow you to be proactive and take steps like speaking to your accountant before the end of financial year to maximise your cash flow throughout the year.
Doing the cash flow analysis also allows you to see how much growth you need in your property in order for you to get the return on investment you want. You can also take proactive steps towards creating this growth if the market isn’t doing it for you.
I hope that these negative geared property examples have enlightened you and will help you do future analysis on properties you are considering buying.
DISCLAIMER No Legal, Financial & Taxation Advice
The Listener, Reader or Viewer acknowledges and agrees that:
- Any information provided by us is provided as general information and for general information purposes only;
- We have not taken the Listener, Reader or Viewers personal and financial circumstances into account when providing information;
- We must not and have not provided legal, financial or taxation advice to the Listener, Reader or Viewer;
- The information provided must be verified by the Listener, Reader or Viewer prior to the Listener, Reader or Viewer acting or relying on the information by an independent professional advisor including a legal, financial, taxation advisor and the Listener, Reader or Viewers accountant;
- The information may not be suitable or applicable to the Listener, Reader or Viewer's individual circumstances;
- We do not hold an Australian Financial Services Licence as defined by section 9 of the Corporations Act 2001 (Cth) and we are not authorised to provide financial services to the Listener, Reader or Viewer, and we have not provided financial services to the Listener, Reader or Viewer.
"This property investment strategy is so simple it actually works"
Want to achieve baseline financial freedom and security through investing in property? Want a low risk, straightforward way to do it? Join more than 20,000 investors who have transformed the way they invest in property."
