
Find Out How Many Properties Sold In A Suburb In The Last 12 Months (Ep230)
[youtube id=”y4T7q0T3Q-U” align=”left” mode=”lazyload” maxwidth=”500″]
When researching a suburb that you’re considering investing in an important metric to look at is how many properties have actually sold in that suburb in the last 12 months. In this lesson I am going to show you how to find out exactly that (and it’s really easy).
Today I’m answering this question’s from Romeo:
“Hello Ryan, when checking out the suburb how do I find how many properties sold in that suburb in a year? Thanks.”
Great question Romeo and this is a great thing that a lot of people might want to know or look at.
There are two websites that I like to use to find out this information.
The reason I use two websites rather than just one is that sometimes the data is different and I don’t like to rely just on one source case that source is wrong. So by having two different sources that I use it allows me to get a more accurate result and I can ensure I’m not getting misrepresentation of the area.
House.Ksou.cn
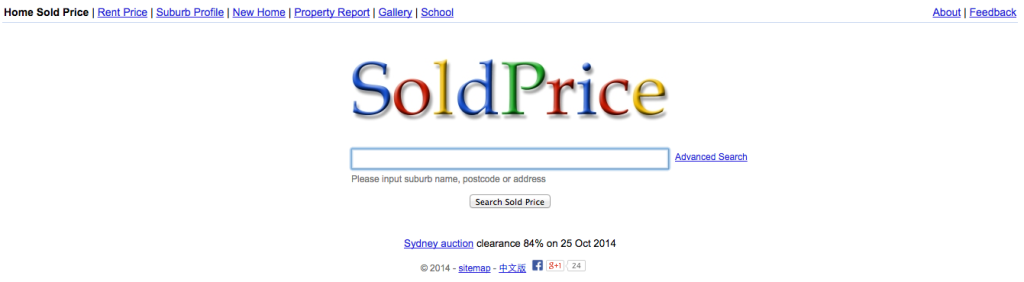
The first website I recommend using is ksou.cn or more specifically house.ksou.cn. This is a website aimed specifically for people in China researching the Australian market because if you type in ksou.cn you’ll see a website come up with no English on it at all.
Step 1: Type “ksou” into Google
The easiest way to find it is to type ksou into Google, choose the first result which is house.ksou.cn.
Step 2: Choose “Suburb Profile” From The Top
We can see here it’s called SoldPrice and there are all these options at the top and what we’re looking for is Suburb Profile.
Step 3: Type In Postcode and Select Suburb
When we click on Suburb Profile and then we type in our post codes. So let’s go with what we’ve been using lately which is Burleigh Heads in Queensland 4220.
Step 4: Look At The Data
We then select Burleigh Heads and then it will show you here under sales data how many properties have sold in the last 12 months. We can see a 124 houses and 294 units. So that is one way to get the result.
YourInvestmentPropertyMag.com.au
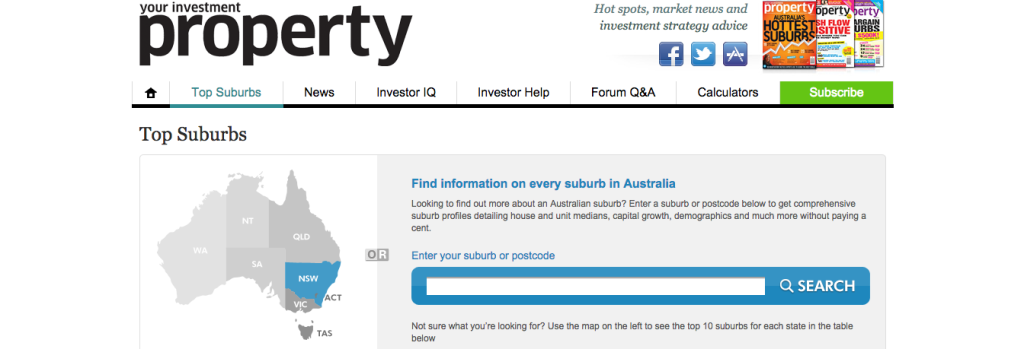
The other website I like to use is your investment property mag.
Step 1: Go To The Website
So just go to yourinvestmentpropertymag.com.au.
Step 2: Click “Top Suburbs” In The Header
hen click this Top Suburbs icon in the header.
Step 3: Choose Your State And Enter Your Postcode
You then choose your state so in this case Queensland and you enter your post code and choose the area of Burleigh Heads, Queensland and then click search.
Step 4: Look At The Data
This will now generate a Suburb Profile for us and we can see a lot more information than ksou gave us. You can see medium prices, quarterly growth, 12 month growth, 3-year, 5-year growth.
This is all the stuff that you usually see in the back of real estate magazines so you can now do it online. We can also see down here number of sales in the last 12 months, 95 houses and 345 units.
Step 5: Compare With Ksou To Ensure Similar Results
Let’s compare that with ksou which says 124 houses and 294 units. So this one is saying less houses and more units however we don’t know exactly what 12 months it is taking.
So I’m not exactly sure how recent this data is on each of those sites but you can see that it’s within range of each other and it is fairly close to each other.
So there are two different methods you can use to find out how many properties were sold in the area in the last 12 months.
It’s also good to look at how many days on the market properties are. You can see that houses in Burleigh Heads have about 60 days on the market and units have about 90 days on the market.
Ksou doesn’t give us that information so you’re going to have to get that from your investment property magazine.
So there you have it, I hoped this has helped you Romeo, I hope this has helped everybody out there and if you have a question please email me ryan@onproperty.com.au and I’ll make you a video which will appear on the YouTube Stream and appear in iTunes for the podcast and get its own blogpost as well.